Luminal
Transform large spreadsheets by describing the work in plain English.
Key Takeaways
- What it is
- Transform large spreadsheets by describing the work in plain English.
- Best for
- AI Spreadsheet Cleaning
- Natural-Language Transformation
- Data Questions
- Rating
- 3.8/5
What is Luminal?
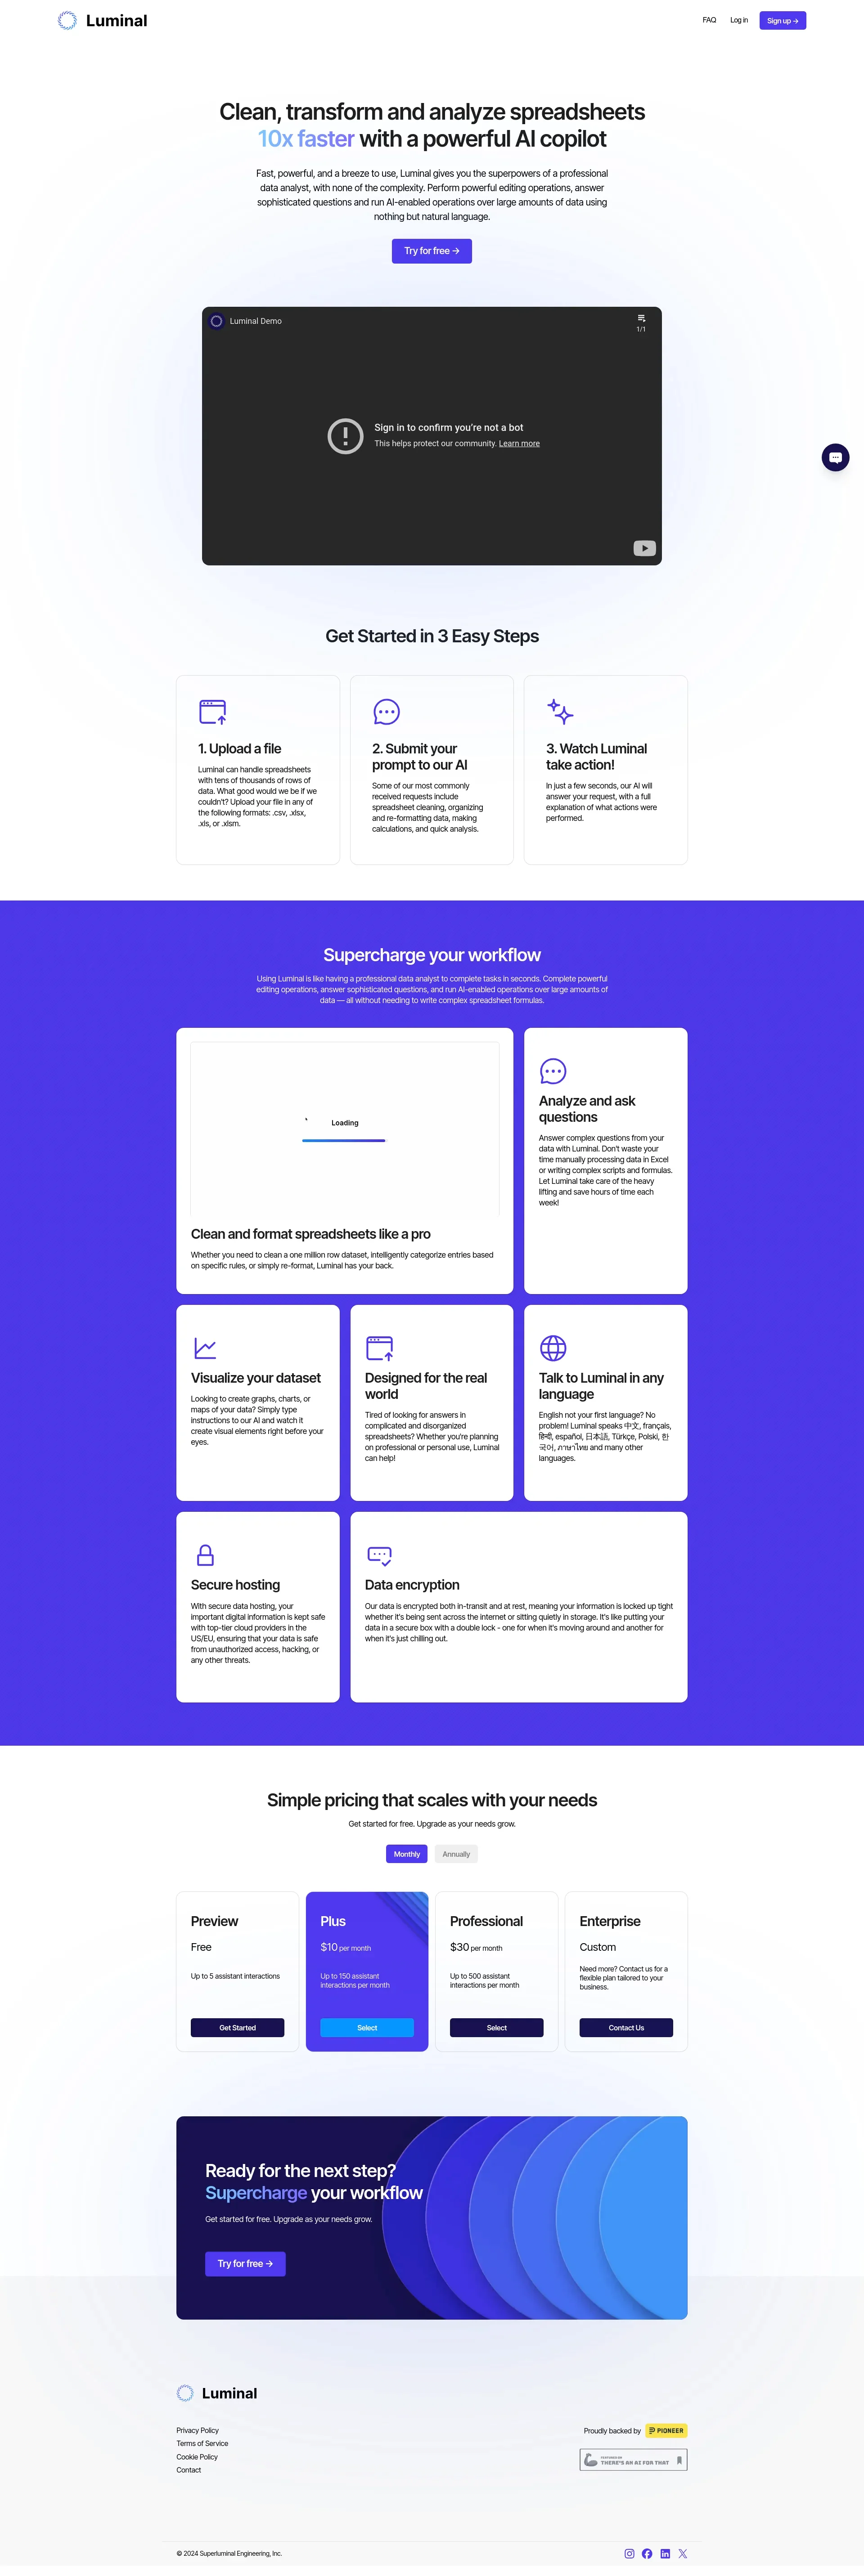
Luminal helps people clean, reformat, transform, and analyze large spreadsheets by describing the task in natural language. It is aimed at data analysts, business professionals, researchers, and anyone who needs answers from messy spreadsheet data without writing complex formulas or scripts.
Luminal applies spreadsheet transformations described in natural language, helping users modify and organize data without requiring complex formulas or scripts.
Luminal fits people who spend substantial time preparing spreadsheet data or answering questions across multiple columns. It is less suitable when you need a mobile app, offline work, or a broad set of business integrations, so its strongest role is focused spreadsheet analysis in the browser.
Who is Using Luminal?
Data Analysts
Their goal is faster preparation, transformation, and analysis of large spreadsheet files.
Business Analysts
Natural-language questions help them find patterns and explanations without building every formula manually.
Financial Analysts
Messy exports and recurring reports can be cleaned and reformatted before deeper analysis.
Marketing Analysts
Campaign and customer spreadsheets can be categorized, summarized, and visualized from written requests.
Researchers
Repeated data preparation tasks can be handled before interpreting a dataset.
Uncommon Use Cases
Generating maps from location data; standardizing personal project or household spreadsheets
Key Features
Rating Breakdown
Pricing Plans
Basic Plan
- Ideal for individuals or small teams starting with Luminal
Professional Plan
- Geared towards growing businesses requiring advanced features
Which Luminal plan should you pick?
Start with the free tier to test spreadsheet cleanup and analysis, then move to a paid plan when your monthly interaction volume requires it.
Basic Plan
Good for individuals testing AI-assisted spreadsheet cleanup and analysis.
Professional Plan
Good for regular spreadsheet work that needs more usage than the entry plan.
Luminal Use Cases
Clean a Messy Spreadsheet
Inconsistent formatting, categories, and entries become a more usable dataset through natural-language instructions.
Outcome: A cleaner spreadsheet ready for analysis or sharing.
Transform Imported Data
Data from exports or other systems can be reorganized into the structure you describe.
Outcome: Less manual reformatting before the data enters the next workflow.
Answer Questions Across Columns
Complex questions about relationships, totals, and patterns can be answered from the uploaded data.
Outcome: Faster findings without constructing several formulas.
Create Data Visualizations
A written request can turn spreadsheet values into charts, graphs, or maps.
Outcome: A visual view of trends and comparisons.
Categorize Records
Entries can be grouped according to rules you describe in everyday language.
Outcome: More consistent labels across a large dataset.
Workflow Ideas with Luminal
Prepare an Imported Spreadsheet
- 1Upload a CSV or Excel spreadsheet.
- 2Describe the formatting, cleaning, or categorization rules.
- 3Review Luminal's explanation and export the transformed data.
Find Patterns in a Dataset
- 1Upload the prepared spreadsheet.
- 2Ask a question that combines multiple columns.
- 3Turn the result into a chart or other visual.
Standardize Repeated Reports
- 1Provide a recurring report file.
- 2Describe the desired column structure and labels.
- 3Reuse the same type of natural-language transformation for the next report.
How Luminal fits into your stack
Spreadsheet Preparation
Luminal sits before reporting or analysis, handling cleanup, categorization, and reformatting of imported files.
Data Exploration
Natural-language questions provide a starting point for finding trends and relationships across columns.
Reporting
Charts, graphs, and maps can help turn spreadsheet findings into material that is easier to present.
Cloud Data Handling
The product works as a browser-based service with data hosted in cloud infrastructure and described as encrypted in transit and at rest.
Pros
- +Plain-language analysis: Spreadsheet work does not depend on advanced formulas or scripting.
- +Large datasets: The product targets files far bigger than typical small spreadsheet jobs.
- +Visualization prompts: Charts, graphs, and maps can be produced from written instructions.
- +Multilingual interaction: Users can work with Luminal in several human languages.
- +Data protection: Information is described as encrypted in transit and at rest.
Cons
- −Narrow focus: Luminal is centered on spreadsheet work rather than general AI tasks.
- −Browser dependency: There is no confirmed native desktop or mobile application.
- −Limited ecosystem: Confirmed third-party integrations are not clearly published.
Limitations & when to consider alternatives
Known limitations
- No Confirmed Native Apps. The available product information does not confirm dedicated iOS, Android, Windows, Mac, or Linux applications.
- Limited File Scope. Luminal is built around spreadsheet formats such as CSV, XLSX, XLS, and XLSM rather than general document processing.
- Large-File Capacity Is Not a Universal Guarantee. The product describes support for very large datasets, but actual performance can depend on the file and requested operation.
Look elsewhere when
- You need a native mobile or desktop app.
- You need confirmed integrations with business systems.
- Your workflow depends on PDFs, images, or general document analysis.
- You need a documented developer API.
How to Use Luminal
- 1
Upload a Spreadsheet
Add a CSV, XLSX, XLS, or XLSM file so Luminal can inspect the data.
- 2
Describe the Desired Result
State the cleaning, transformation, calculation, or analysis you need in plain language.
- 3
Review the Actions
Read Luminal's explanation of what it changed or found before relying on the result.
- 4
Check the Output
Inspect the transformed data and confirm that categories, formatting, and calculations match your goal.
- 5
Create a Visual
Request a chart, graph, or map when a visual comparison will make the result easier to understand.
Who is Luminal For?
Data Analysts
Useful for cleaning large files, preparing datasets, and answering questions across many columns.
Business Professionals
Helps turn operational spreadsheets into organized data and readable findings.
Researchers
Supports repetitive preparation and exploration of spreadsheet-based research data.
Finance and Marketing Teams
Fits teams that regularly work with exports, lists, reports, and performance data.
Personal Spreadsheet Users
Can reduce the manual work involved in organizing budgets, project files, and other structured data.
Frequently Asked Questions
Does Luminal have a free plan?
Yes. Luminal has a free tier, with paid plans available for higher usage.
What spreadsheet files can Luminal process?
The documented file types include CSV, XLSX, XLS, and XLSM.
Can Luminal analyze large datasets?
Luminal is described as handling tens of thousands of rows, with examples of workloads reaching about one million rows.
Can Luminal create charts?
Yes. Users can request graphs, charts, and maps with natural-language instructions.
Does Luminal require spreadsheet formulas?
No. The product is designed around natural-language requests rather than complex formulas or scripts.
How does Luminal protect uploaded data?
Available product information says data is encrypted both in transit and at rest and hosted with cloud providers in the United States and/or European Union.
Community reviews
3 reviews from people who use Luminal.
Sign in to leave a review for Luminal.
Isaac Duncanof
Adil Dahya
Sofia Vargas
Luminal Alternatives
Looking for alternatives to Luminal? Here are similar tools in the same category: